
Data Science steps in simple language for Public Policy
This article would help you understand various data tools and their roles to solve the complex challenges of our time.

As the preamble states, we the people of the country, which means that people of the country are supreme, and collectively they have given power to the Government to form policies according to different needs and aspirations of different classes of the society.
Introduction :
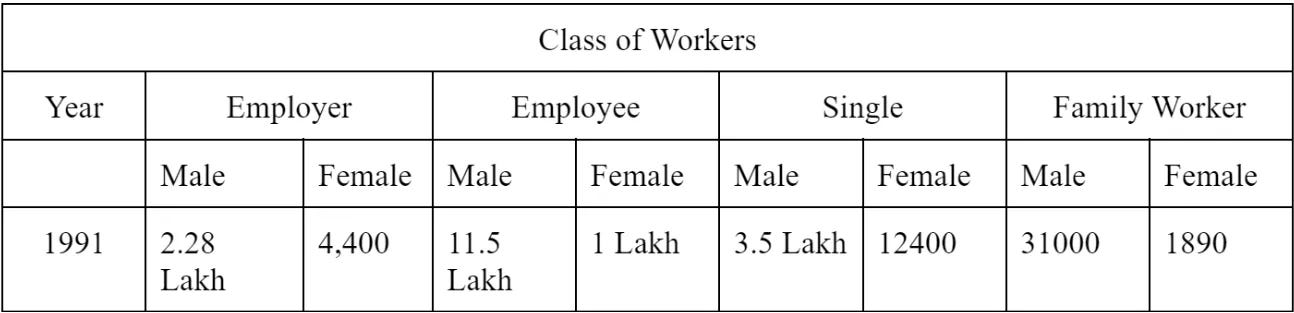
In 1991 census, the population was less and the data used to categorized in less segments.
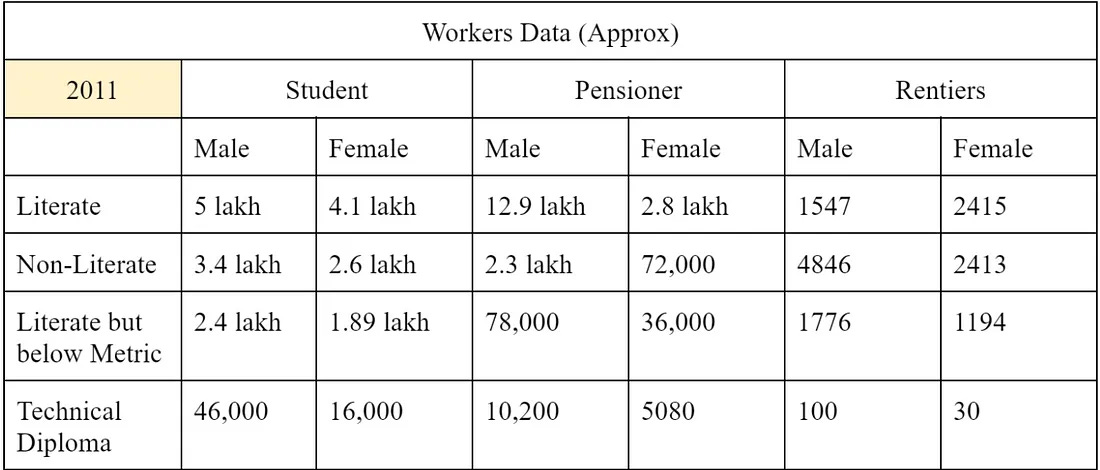
Coming straight to 2011, the population has risen and simultaneously their income levels. The government collects more categorized data which understand the needs of society at different levels and then creates welfare policies for them.
Need : To tackle such diverse data, new-age issues, and aspirations requires a new approach for policymakers who can combine the power of data with policy to create a solution.
“Data” — An Excel sheet comes to mind with thousands of entries
“Science” — People working in labs try to discover something
Combining both, we might think of it as Tech-Savvy, but it’s not entirely so, and more of a creative domain which can be used by social science students to gain insights in a desired domain. It is used so that data speaks for itself, and every data point, when combined, tells a story which helps to understand the situations better.
For Example: In Table 1. If we take a glance, then we can find that female participation in the workforce is not high, so we need to form a policy which encourages women to come out of the house and join the workforce.
A more simplistic definition would be that it is a coding math-based tool used for an inclusive analysis by taking unstructured data to find insightful and compelling answers to your research questions.
The Data Science for Public Policy works at the intersection of coding, statistics and public policy knowledge.
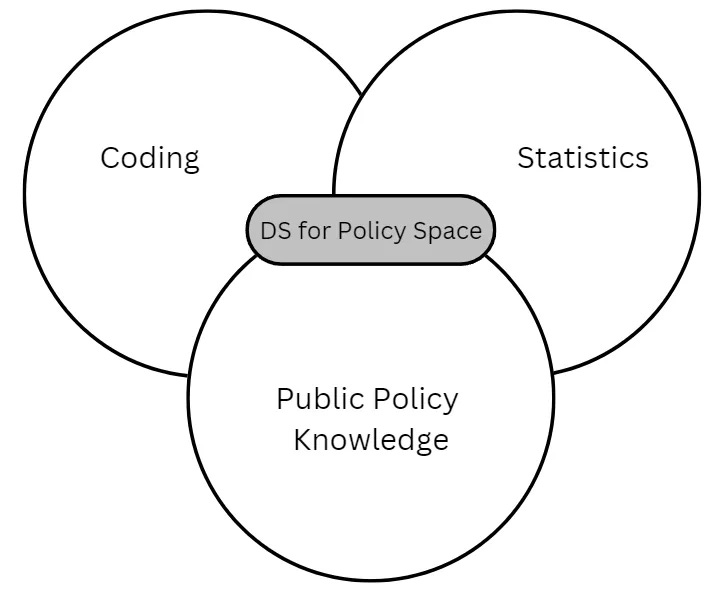
When we statistical tools with the domain knowledge, we generally perform a traditional research like writing research papers. Generally, in this case, data used is generally structured and efforts are put into the interpretation of data.
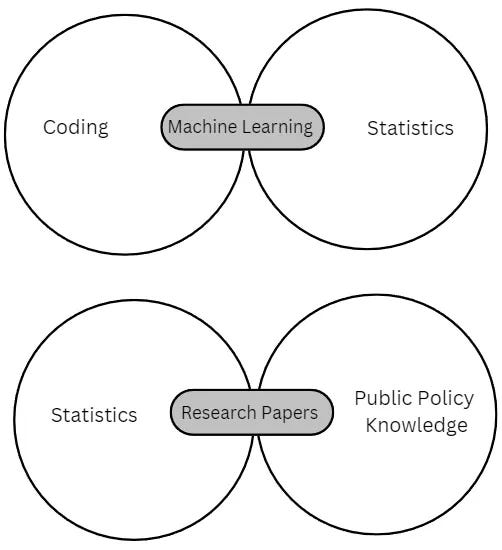
Machine learning is about teaching computers through coding to work on a certain algorithm, which is generally developed through statistical tools.
Coding helps us to gather and prepare data for analysis and statistical maths helps to choose the appropriate procedure to answer questions and diagnose problems if something goes wrong
Tools which are used in research domain :
Statistical Coding tools — R (specifically used for Data Analysis) and Python
Database — MySQL (Structured Query Language)
Generally, any project involving data science goes through 3 stages :
Planning and Data Prep — Defining insights which you want to take out from data and organize the data which you might be getting from different sources
Modelling — Creating different statistical models like Regression Analysis is done through Regression modelling
Presenting the Data — You need to present the data in a manner which is understandable to the reader
There are certain domains of dealing with Data which you will have to learn such as Data Sourcing, Analysis, Visualization etc
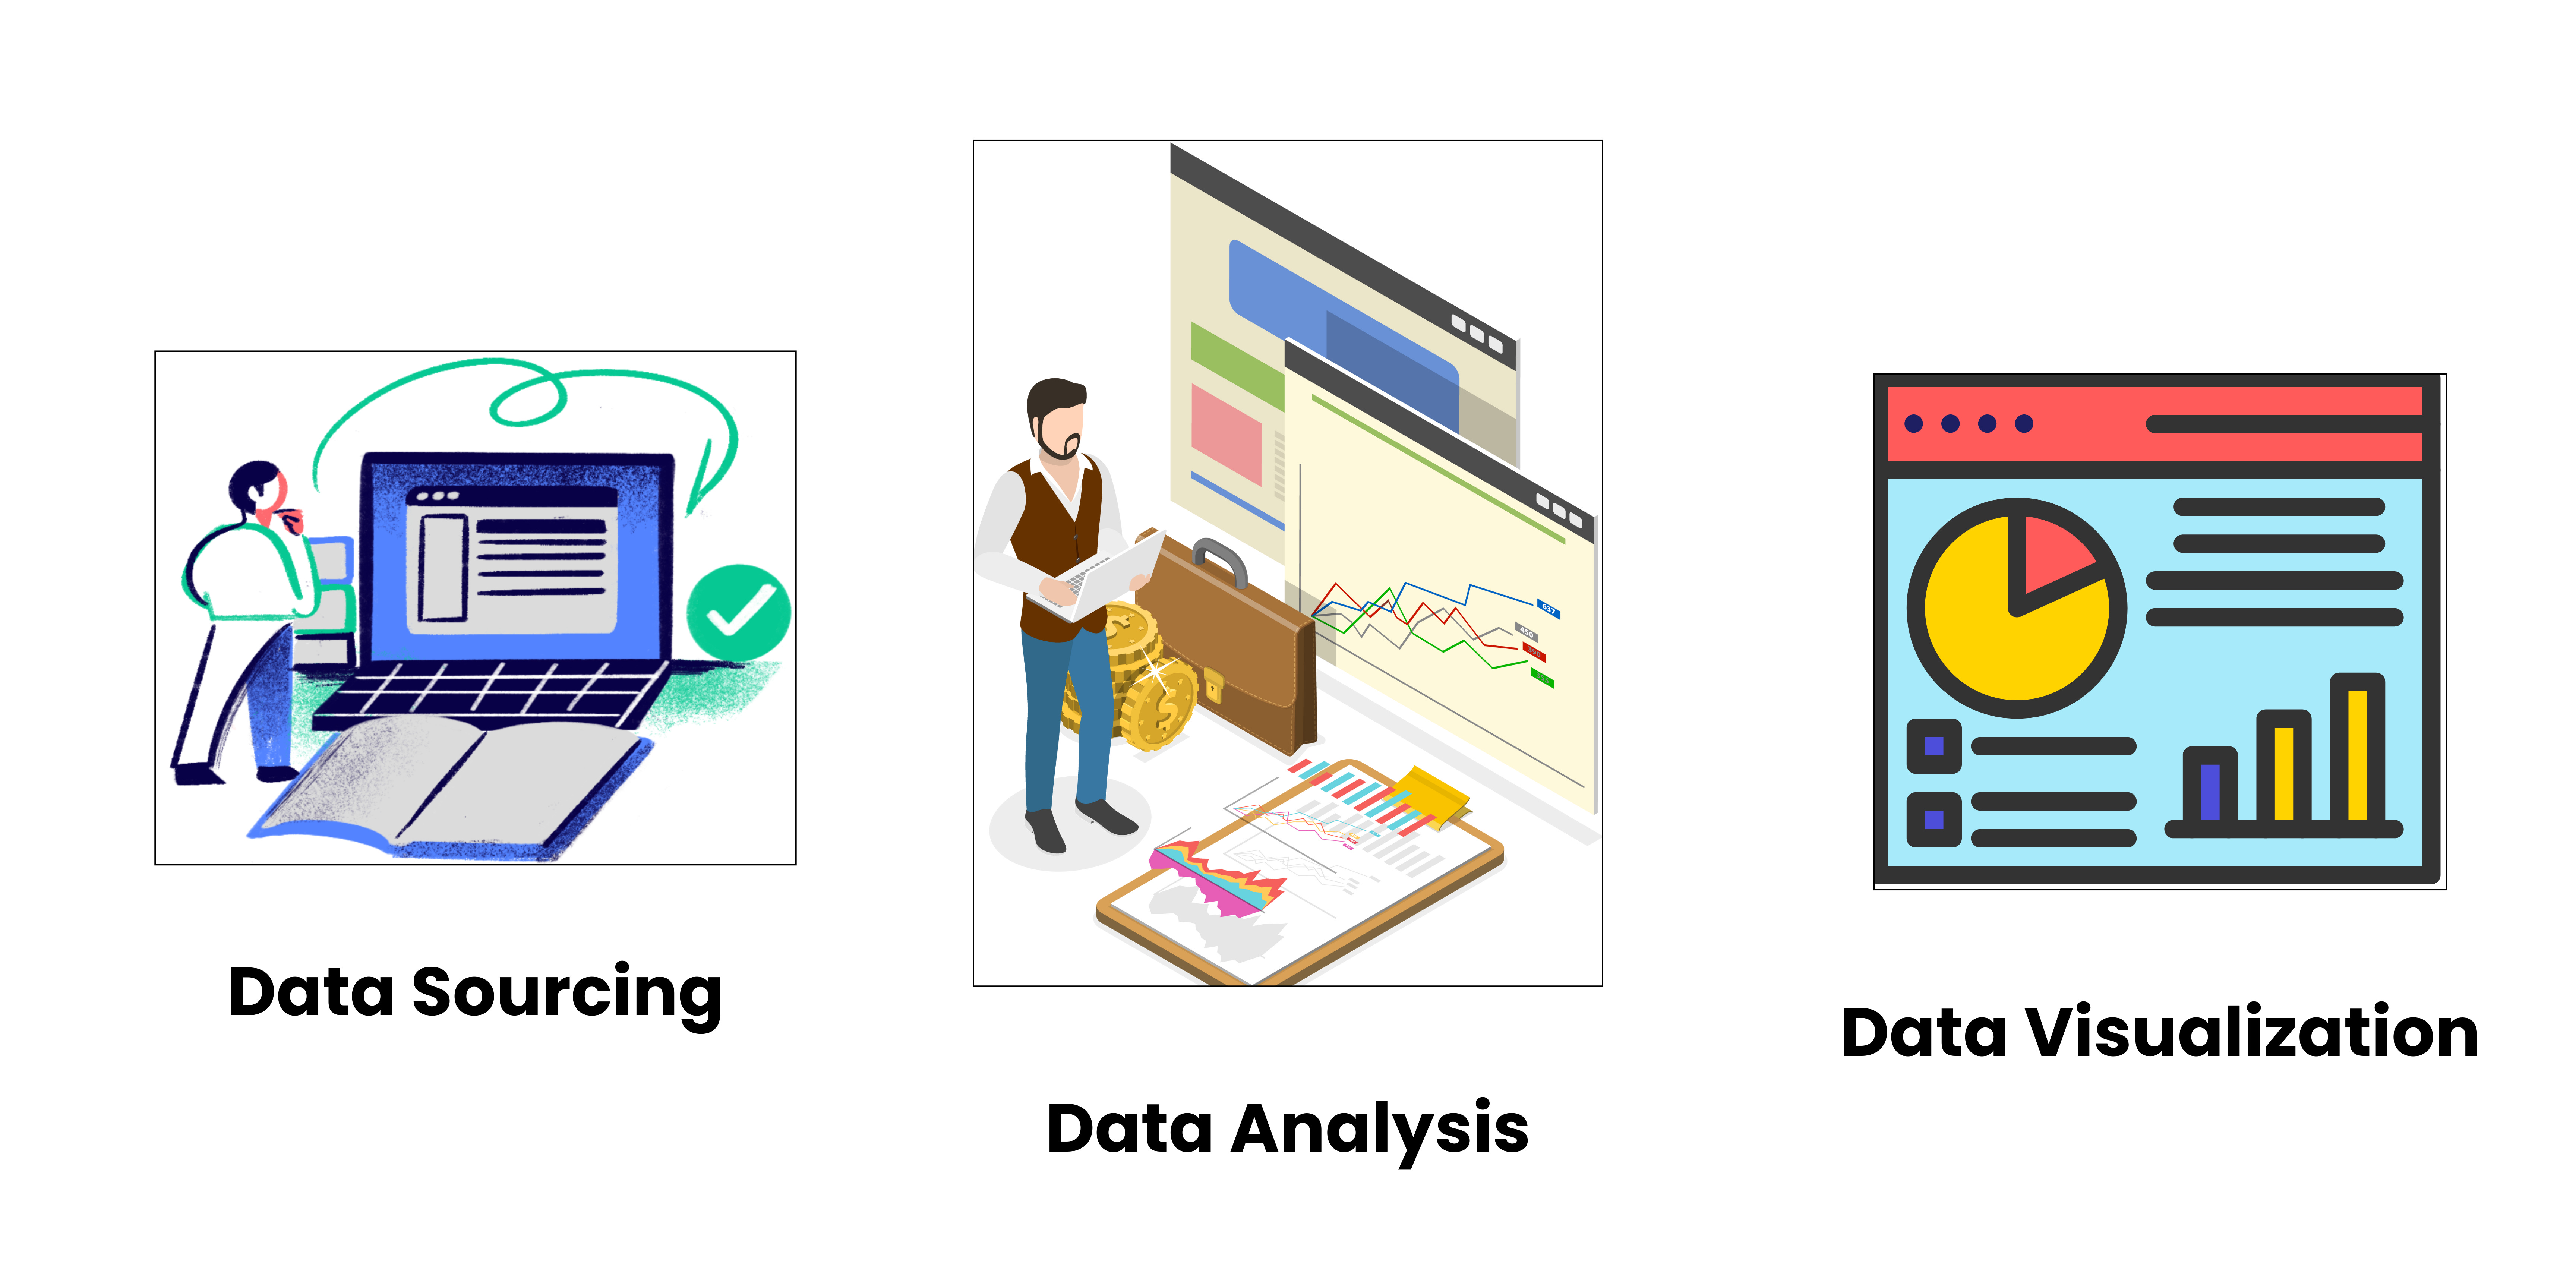
Data Sourcing
There are high chances you have heard of Google and Kaggle datasets or you might have worked with those datasets.
Data source suggests an origin, possibly in physical or digital form; It is the origin point where data takes birth or it is first stored digitally.
The source could either be through physical means like surveys, or interviews, or through digital means like readings from sensors. Let’s see the nature of data during the transition into the digital phase, and then delve into digital data sources while discussing their advantages and disadvantages.
Physical Data Sources
If we go back in time, when researchers used to collect data through printed sheets with questions and then categorize the responses of surveys. After categorization, it used to be converted into digital formats for visualization and analysis.
a) Primary source - the first-hand information about any event like physical surveys, census, diaries, memoirs
b) Secondary sources - it includes information derived from third party sources, where we use secondary sources to interpret the primary information. like IMF research reports based on data submitted by governments.
c) Tertiary — engages data from both the secondary and primary sources.
The Nature of Data While Transitioning
The data collected from physical sources could be presented in digitized format, majorly in these ways :
Structured — the data is organized in a tabular format with rows and columns. There is a relationship between the rows and columns. CSV files, Excel sheets, and database management systems are structured
Unstructured — Has no pre-defined structure, and no data model. The data is irregular and ambiguous. Social media sentiments and open-ended surveys are unstructured. 80% of the data in the world is unstructured.
Semi-structured — Sits in the middle of both structured and unstructured sources.
Digital Data Sources
Computer Files
Computer files are a common source of data for data science projects. These files can be in various formats, such as CSV, Excel, JSON, XML, text files, and more.
Databases Sources
Databases are structured repositories that store data in a well-organized manner, making it easier to query and retrieve information. Common types include SQL databases (e.g., MySQL, PostgreSQL) and NoSQL databases (e.g., MongoDB, Cassandra).
Web-Based Sources
Web-based sources encompass a wide range of data available on the internet. This includes data from APIs (Application Programming Interface), web scraping, social media platforms, online surveys, and more.
Now that you’re acquainted with the data sources concerning the origin of data within the data science process — spanning from physical sources to digital ones — as well as the myriad advantages and disadvantages inherent in various digital sources, how will you now assess the status of Kaggle and Google when it comes to data acquisition?
Step 2: Data Collection
There are a lot of ways to collect the data like:
Through API — Mostly this is a cleaned form of data and does not require further cleaning.
Web Scraping — Most of the time you will need to spend a good amount of time cleaning such data.
Transactional Data
Online Marketing Analytics Data (Customer Journey, etc.)
Surveys and Interviews, etc.. etc…
The best way to get the data for Data Analysis or Visualization according to me would be to use an API as mostly they are clean. But if you are an offline or online store like Walmart or Amazon, you will be having huge transactional data. A good DBA would make sure to keep this data in the cleaned format, so an Analyst will only have to query the data according to the requirement from this huge pile of data and do the analysis. Even the Online Marketing Analytics or Survey Data will be in a cleaned format, but methods like Web Scraping can consume a lot of time in Data Cleaning. You can write all the cleaning codes in the script only so that the final scraped output you get is clean and ready to use. The biggest pain is cleaning the text data, I have worked on it can be really frustrating sometimes.
So for this article, I have used an API provided by the Government Of India on their website https://data.gov.in/, I found this API where they were providing Air Pollution data for about 1200 places across different cities and states in India on an hourly basis. Different metrics like PM2.5, PM10, NO2, NH3, SO2, CO, and Ozone’s Maximum, Minimum, and Average values were collected.
This data was provided on an hourly basis, so if you hit this API at 3 PM, it will provide you the data collected till 2 PM for the 1200 places, but if you hit this API at 5 PM you will get the data for 4 PM. Hence you cannot get the past data from this API, so you have to create a DB to append the new data every hour.
So, we need to learn the art of dealing with data, which is data science.
Note : I will be referring to “Data Science” in the broadest sense, meaning practicing of drawing meaningful insights from large amounts of data
Data Science might be the best thing you could have learned in your career, but data science is not the silver bullet solution to the world’s problems, especially in the policy space.
First requirement remains reading and understanding the context of any issue
The problems that data science attempts to address would be interdisciplinary and complex, so before presenting or jumping onto any analysis it is necessary to learn about the historical, socio-economic underpinnings of the issue.
Data Science helps to develop the scalable human mental models, which improves the decision-making in an unprecedented way.
Evidence-Based Policy Making refers to an approach in public policy where policy is informed and guided by rigorous and objective evidence.
This approach contrasts with making policy decisions based solely on ideology, personal opinions, anecdotal evidence, or common sense. In this, policymakers seek to use data, research findings, and scientific methods to understand the potential impacts of different policy options and to choose the most effective and efficient solutions.
EBPM involves systematically gathering and analyzing relevant data, often employing research methods such as randomized controlled trials (RCTs), surveys, case studies, and economic modeling. The goal is to ensure that policy decisions are grounded in credible evidence and have a higher likelihood of achieving the desired outcomes.
By emphasizing evidence, EBPM aims to enhance the quality and effectiveness of policies, leading to better-informed decisions that can address complex societal challenges. It also promotes transparency, accountability, and a more rational allocation of resources among the decision-making players.
Challenges:
Privacy and Ethics : The collection and use of personal data raise concerns about privacy and ethical considerations.
Data Quality : Data quality and accuracy are paramount as if decisions are based on flawed data they can be adverse consequences.
Digital Divide : Not all citizens have equal access to digital services or technologies, potentially creating disparities in access to government services and benefits.
Security : The digitization of government services makes it susceptible to cyber threat, so robust cybersecurity measures are vital to safeguard sensitive data.
Previously limited to the business sector, storytelling via data visualization has been widely recognized in the academia sector.
According to a recent study, the amount of data being generated each year is expected to reach 175 zettabytes by 2025.
Anything which you are not able to communicate effectively is a waste of time, we always heard or often meet people who are super-intelligent but fails at communication.
The answer is Visualization, starting from the Idea Visualization in your brain to its visualization on paper or on your desktop screen. In the Public Policy context specifically, the greater challenge remains is How the resulted information reach the targeted audience and considering at the times of Social Media?
How you can ensure that your research is actually understood by the layman, or your senior at office and properly decoded in the mind, avoiding the information overload. In the jargon terms, it is more often referred to as Decentralization (and democratization) of research produced. The old method of academician of writing a well-researched blog will not help now, you need to make the information interesting.
Data visualization, in the simplest manner, is graphical formats of any information such as 2D or 3D charts, diagrams, maps, pictures or alike
Data Viz 1/4: Storytelling and Context Develop the ability to understand data deeply and create visualisations that tell a clear, concise story. Know the purpose of your visualisation and provide context for your audience.
Data Viz 2/4: Visualisation Design Master design principles such as data-ink ratio, effective colour usage, and clarity in labels to create visually appealing and informative visualisations.
Data Viz 3/4: Chart Selection and Techniques Learn various chart types and techniques for different data types and analysis goals. Choose the best representation to convey insights accurately.
Data Viz 4/4: Data Integrity and Accuracy Ensure data accuracy, perform data cleaning, and handle missing values properly to avoid misleading visualisations.
Data mining is the technique of examining a large data structure to find patterns, trends, hidden insights which would otherwise would not be possible using simpler query based techniques.
It uses sophisticated mathematical algorithms to classify, divide, segment the entire data, pre-process it as necessary and evaluate the possibility of future events.
Data Mining is also known as Knowledge Discovery in Data or KDD
What are the key characteristics?
Prediction of likely outcomes or events
Information about actions that can be taken
Automated discovery of patterns
Focus on large datasets and databases
How is it different from Machine learning?
Data mining is considerably different from Machine Learning (ML) but they go hand in hand. First we should understand that Data mining is different from Data Extraction. Once we have extracted the data via Scraping or any other source, the technique of finding patters is called data mining.
Machine Learning is the science of creating algorithms, neural networks and programs which learn on their own or are trained initially by known data. Once developed they do not need human interference to improve.
Some applications of Machine learning are Web Search, Image recognition, NLP, Spam filters, recommender systems, ad placement, credit scoring, fraud detection, stock trading, computer vision and drug design.
Data mining is the very first step in data science.
To find patters of hidden insights in data, data mining uses anomaly detection, cluster analysis, association rule mining, et al
Some other key differentiators between data mining and ML are as follows:
Data mining works on unstructured data; ML uses algorithms and neural networks.
Data mining sources data from a data warehouse whereas ML reads from external machines, could be data sets as well or live user input.
Data mining has focus on applications and algorithms, whereas ML focuses on theoretical part.
What is Big Data
Generally, people use the term “Data” and “Big Data” interchangeably, but Big Data refers to when the Volume, Velocity and Variety of Data combines
Volume of data example is GPS Navigation Data which has a huge amount of data points involved
Velocity — It refers to the speed at which data is entered into a system and processed, like Amazon collects data on every click and is stored in databases
Variety is where distinctive data is collected every time, like Facial Recognition system